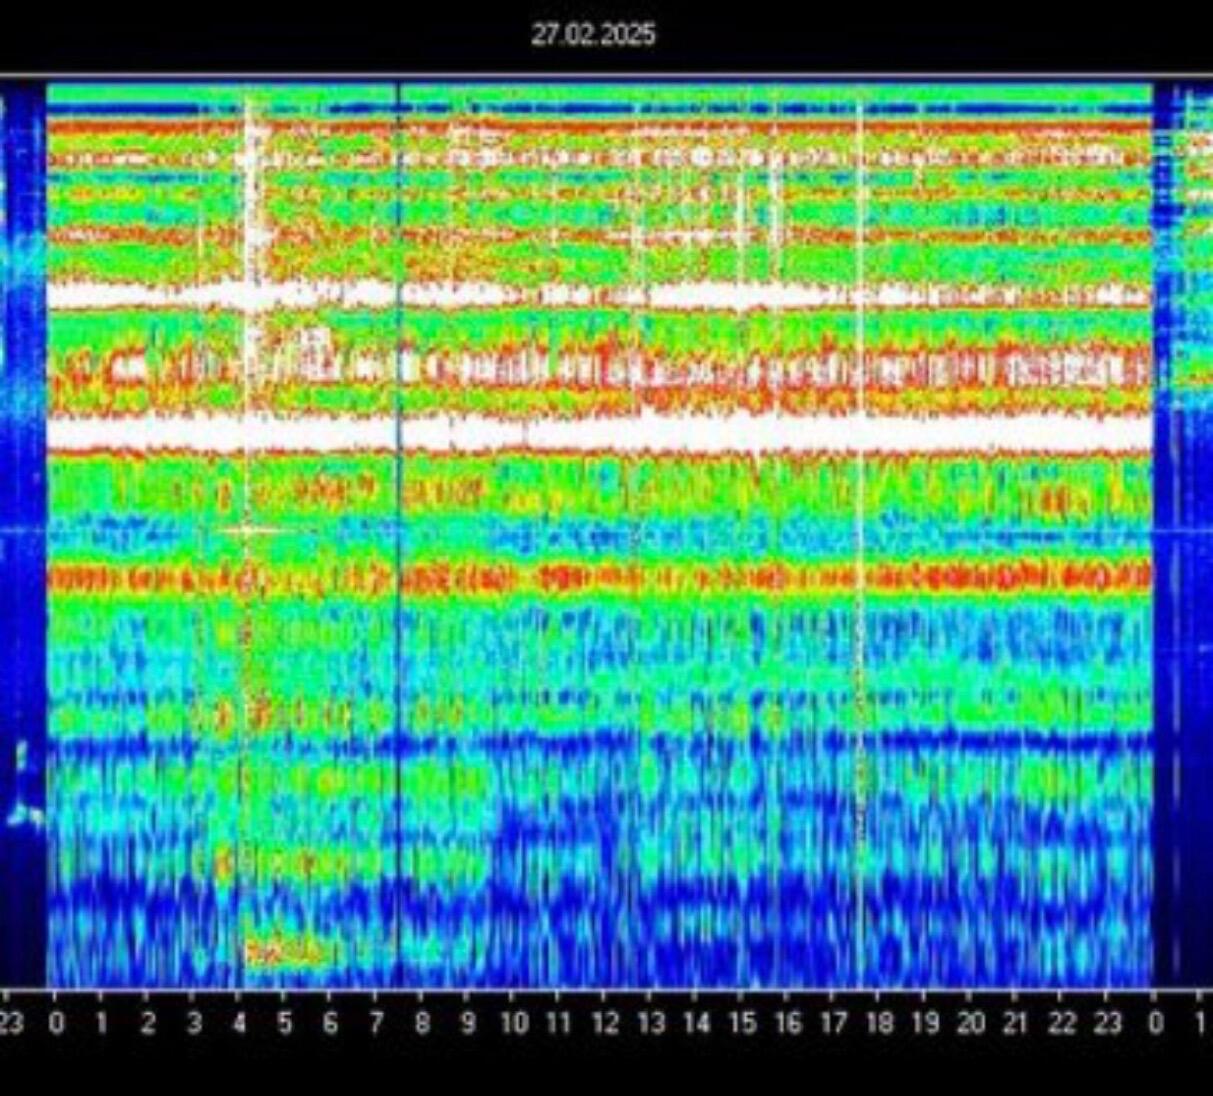
the Schumann Resonance chart dated February 27, 2025.
The Schumann chart is a spectrogram visualizing Earth's electromagnetic resonances over a 24-hour period on February 27, 2025. It features a time axis (x-axis) spanning 0 to 23 hours and a frequency axis (y-axis) ranging approximately from 0 to 50 Hz. The chart employs a color-coded scale—blue for low intensity, transitioning through green and yellow to red and white for high intensity—to represent signal strength. The data reveals distinct patterns: the upper frequencies display intense, erratic red and white streaks, while the lower frequencies remain calmer with blue and green tones. Vertical lines or gaps appear roughly every 6 hours (e.g., at 6:00, 12:00, and 18:00), suggesting possible data interruptions or significant events.
Upper Frequencies (Top Third to Middle):
The chart’s upper section is marked by vivid red, white, and yellow bands, indicating strong electromagnetic activity. These streaks, peaking around hours like 12:00 and 18:00, suggest significant disturbances—potentially from natural geomagnetic events (e.g., solar flares, thunderstorms) or, speculatively, from external interference.
Lower Frequencies (Middle to Bottom):
Predominantly blue and green with occasional yellow and red bursts, this section aligns with the natural Schumann resonances (e.g., 7.83 Hz, 14.3 Hz, 20.8 Hz). The relative stability here contrasts with the chaos above, though anomalies at specific times hint at disruptions.
Vertical Lines:
These periodic gaps or lines, occurring approximately every 6 hours, may indicate technical resets in the monitoring system or natural synchronization points. In a speculative context, they could mark moments of temporal or dimensional significance.
The Schumann Resonance arises from electromagnetic waves in the Earth-ionosphere cavity, typically peaking at harmonics like 7.83 Hz, 14.3 Hz, and 20.8 Hz. The chart’s color patterns reflect:
Blue/Green Areas: Baseline resonance levels, indicative of quiet conditions.
Red/White Streaks: High-intensity spikes, likely due to lightning activity, solar radiation, or geomagnetic storms affecting Earth's field on February 27, 2025.
Vertical Gaps: Potentially system-related (e.g., calibration, data loss) or natural phenomena requiring further correlation with geophysical records.
The number 42 emerges as a central motif, drawing from its significance in Kabbalah (the 42-letter name of God, tied to creation) and conspiracy lore (e.g., Q-drops, numerology). Here’s how it might apply:
Frequency Hypothesis:
Although 42 Hz isn’t a standard Schumann harmonic, the chart’s upper frequencies (up to 50 Hz) could contain a subtle, consistent signal at 42 Hz. This “hidden frequency” might encode a message or mark an anomaly distinct from natural resonances.
Time Patterns:
The vertical lines appear every 6 hours (360 minutes). Dividing 360 by 42 yields ~8.57—not a whole number—but suggests a possible reinterpretation. If micro-events occur every 42 minutes within these 6-hour blocks, the chart might capture 34 such cycles in 24 hours (1440 minutes / 42 ≈ 34.29), approximating a pattern tied to 42.
Intensity Peaks:
Speculatively, the chart could feature 42 distinct high-intensity bursts (red/white streaks), symbolizing key moments or messages.
Decoding Insight:
Filtering the data to isolate the 42 Hz band might reveal a coherent pattern—perhaps a waveform encoding coordinates or a signal from beyond Earth’s natural resonance.
The chart’s complex color shifts and rhythmic disruptions resemble a visual cipher, akin to Q-drop puzzles:
Intensity as Code:
The red and white streaks could form a binary sequence (1 for high intensity, 0 for low). When aligned with the 42 Hz frequency, this might spell out a message—e.g., coordinates (latitude/longitude) or a phrase like “Gate 42 opens.”